
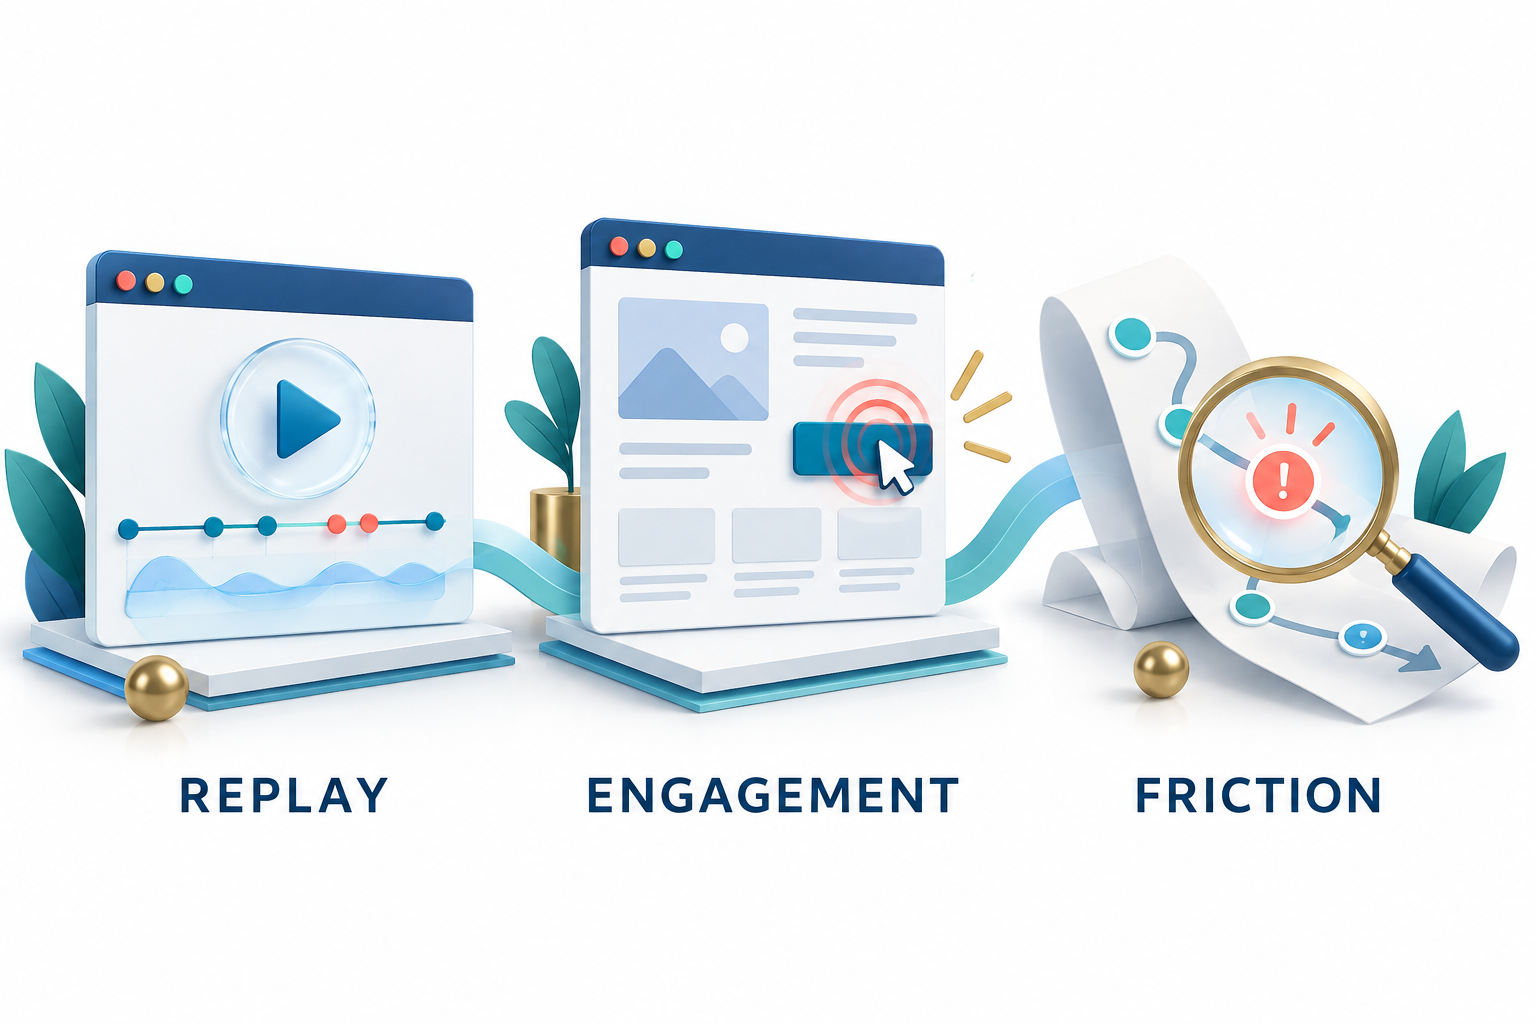
A conversion report shows the outcome. JourneyLens helps investigate the journey.
A store can know how many customers reached checkout and still struggle to explain why others stopped. A service business can see traffic to a quote form without knowing whether visitors encountered an unresponsive button. A marketing team can celebrate a campaign while a mobile layout quietly makes the next step difficult.
RAS JourneyLens connects recorded interactions, replay, page engagement, friction signals, commerce milestones, and reporting. Its value is not simply the ability to watch a visit. It is the ability to move from a pattern worth investigating to the recorded evidence behind it, then give the team a clearer basis for action.
This guide covers the current feature set, from collection settings to investigation and reporting. The visuals are conceptual illustrations, not product screenshots, customer recordings, or measured results. Available evidence depends on the deployed version, enabled capture settings, integrations, and recorded sample.
1. Organize investigation around one workspace
JourneyLens provides Overview, Reports, Heatmaps, Recordings, Settings, and Help. Together, these areas support a practical sequence: establish what changed, locate the affected pages or interactions, inspect representative recordings, and document what should happen next.
Overview includes session-based summaries, prioritized issue categories, saved investigations, and release comparisons. Reports expands that view into Conversion & funnels, Pages & engagement, and Friction & errors. Custom funnel management is available from conversion reporting, while Data health is reached through Settings and coverage guidance.
That structure matters for teams with limited time. Starting from a defined problem is more useful than opening a long list of recordings and hoping an important pattern appears.
2. Capture the interactions that explain a visit
Configurable recording includes mouse movement, clicks and taps, scrolling, form focus and blur activity, form abandonment, and console errors. Masked page snapshots give the replay viewer visual context. Where enabled and considered safe, clicked-element text excerpts can help identify what a visitor was interacting with.
Page and session records provide context such as visited URLs, duration, device, browser, viewport, clicks, maximum scroll, and captured errors. The recorder also maintains page context across supported single-page-application navigation and upload retries, helping associate events with the page where they occurred.
These are captured observations, not a complete account of the visitor's intentions. A long session may reflect interest, interruption, or confusion. A short visit may be successful. JourneyLens avoids treating duration, extra pageviews, or low scroll depth alone as proof of friction.
3. Find the recordings that answer a specific question
The Recordings workspace supports filtering by site, date, device, traffic classification, conversion status, friction signal, viewport band, and console-error presence. Sorting options include most recent, highest friction, longest duration, and greatest scroll depth. Session rows summarize the visit before the reviewer opens it.
For example, a team investigating a mobile checkout problem can narrow the population to the relevant device and signal instead of mixing those visits with unrelated desktop browsing. CSV export helps carry the filtered recording list into an operational review, while authorized deletion supports recording management.
Filtering is the first step toward useful evidence. One unusual replay can reveal a defect, but it does not establish how widespread that defect is. The stronger workflow combines the recording with the affected-session counts and page context in Reports.
4. Replay a session with controls built for investigation
The replay viewer includes play, pause, rewind, and 1x, 2x, or 4x playback. Optional idle-gap skipping reduces time spent watching inactivity. Reviewers can search for an event or selector, move to the next match, and jump between occurrences of timeline markers. Captured commerce event names appear in the current marker.
Visited-page and timeline tables provide another way to inspect the sequence without relying entirely on animation. Playback follows captured timestamps and selects an available page checkpoint at or before the event being shown.
The visual record is intentionally bounded. JourneyLens stores up to twelve sanitized checkpoints per page, with capture spacing of at least fifteen seconds. It is not continuous DOM-mutation replay, video, canvas recording, or a recording of cross-origin iframe contents. Dynamic content and external assets can differ from the original visit.
That distinction helps reviewers use replay appropriately: as evidence of captured interactions and approximate page states, not a frame-perfect movie of everything a customer saw.
5. Surface friction signals without confusing them with certainty
JourneyLens identifies rage clicks, dead clicks, form abandonment, and captured errors as investigation signals. Friction reporting groups signals by canonical page, element, and signal type, then ranks groups by distinct affected sessions. One session may appear in more than one issue group.
Dead-click detection focuses on actionable controls with no observed page-change, navigation, or semantic-event response after approximately 1.2 seconds. Form abandonment means an edited form was left without submission; moving between fields is not, by itself, abandonment.
These definitions reduce some common false signals, but they remain heuristics. A repeated click does not prove anger, and a missing observed response does not prove that no backend work occurred. Replay review, reproduction, and technical context should determine whether a fix is needed.
The commercial value is better prioritization. A repeatedly unresponsive purchase control deserves a different investigation from an isolated click on a nonessential page element.
6. Compare page engagement before redesigning the page
Pages & engagement reports group query variants by canonical page URL. They show pageviews, distinct sessions, click reach, scroll reach, and pageviews with friction. Teams can filter by site, dates, device, and traffic, then compare the selected period with an equal-length preceding period.
This helps separate two different questions: does an important page attract visits, and do those visits reach or interact with its important elements? A product page can have substantial traffic while a delivery explanation remains far below the depth most recorded visits reach.
Pageviews and sessions are different denominators. Query-based page variants are also grouped together, so a store that uses query parameters to change major page content should interpret the grouping carefully. Reach is an observation of exposure or interaction, not proof that content was understood.
7. Inspect click hotspots and scroll reach on recorded layouts
The Heatmaps workspace starts with dates, traffic, and device filters. Teams can choose built-in commerce page groups or enter a custom path pattern such as a product-page path. Filtered URLs can be bookmarked for reuse; these groups are URL-based views rather than separate stored audience definitions.
Opening a page exposes element click counts and reach, scroll thresholds, and example recordings. The visual viewer offers Click hotspots and Scroll reach on a masked stored snapshot. Compatible snapshot hashes and viewport or document dimensions keep different layouts from being combined into one misleading overlay.
Click hotspots help locate interaction concentration. Scroll bands estimate how far the bottom of the viewport reached, with the initial viewport counted as reached. Neither tells the team where someone looked or whether they read the content.
Missing snapshots and incompatible coordinates are surfaced as coverage issues. Older clicks without the required scroll offsets can remain in element counts while being excluded from the visual overlay. As a result, the page-wide summary and a selected compatible-layout overlay may have different denominators.

8. Connect commerce milestones to the recorded journey
JourneyLens can receive product views, cart activity, checkout milestones, and purchase events through the existing EDSA commerce integration. Custom milestones can add context such as a validation error at a particular step. Custom metadata is deliberately limited to selected fields such as order ID, product ID, currency, step, code, and release.
Sites can explicitly enable commerce-only capture on excluded pages. This allows configured checkout milestones to be observed without collecting the excluded page's DOM, field interactions, click coordinates, or page title. It offers a narrower measurement option while preserving sensitive-page exclusions.
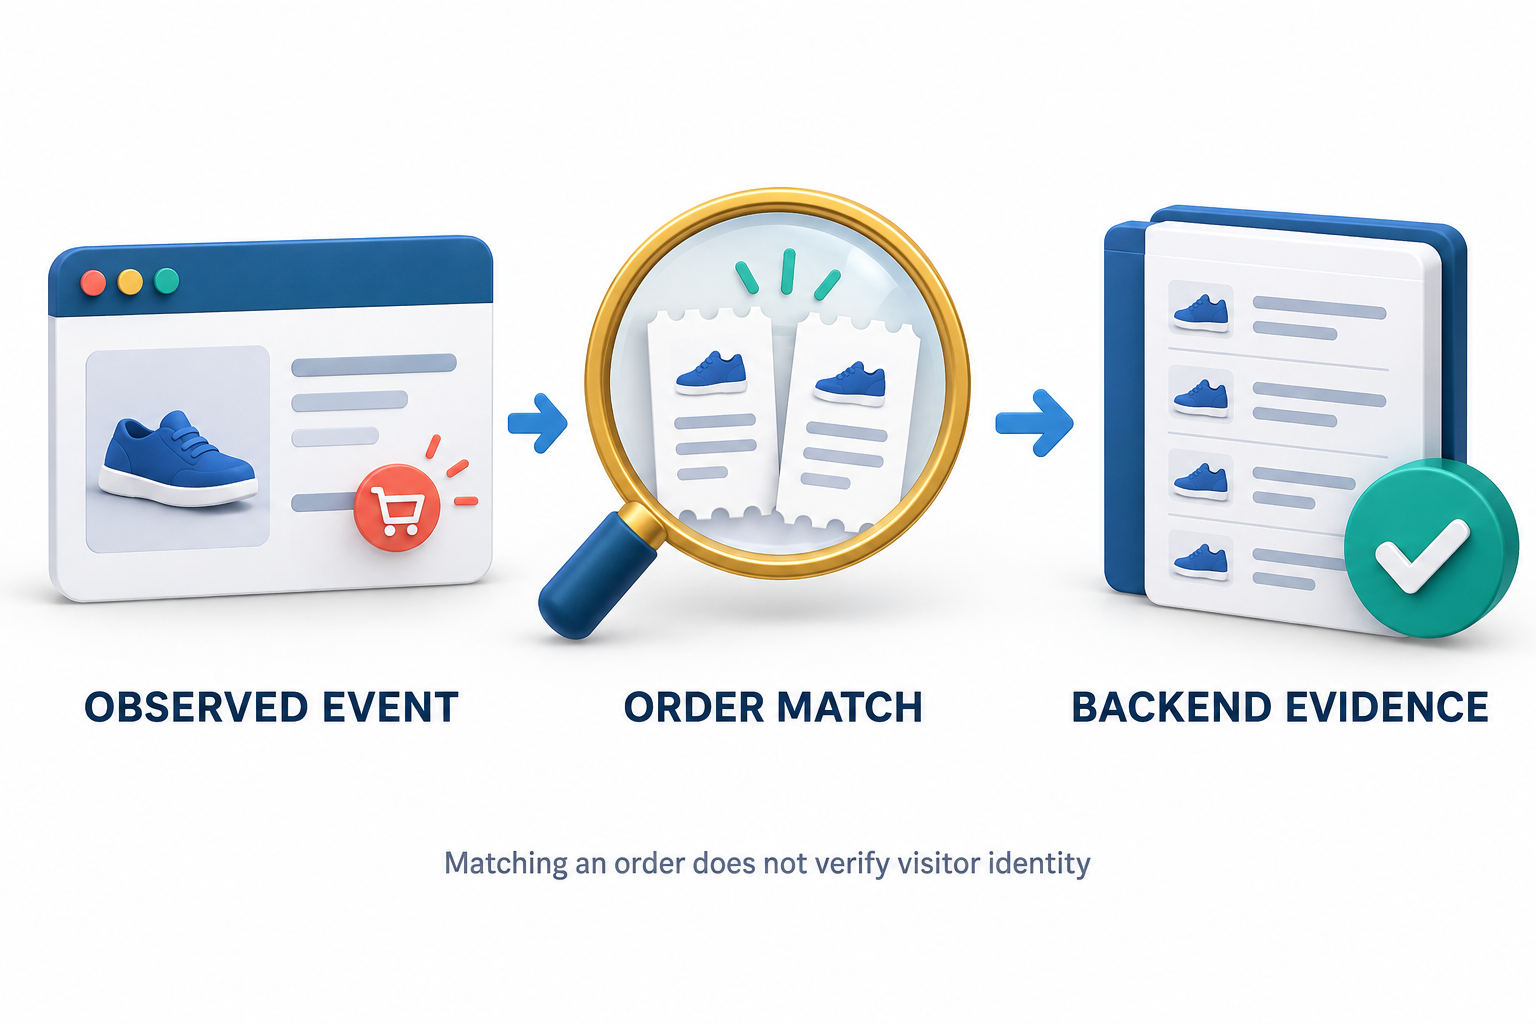
Purchase evidence remains carefully separated. A browser-reported purchase is an observed event. JourneyLens can additionally match the exact site and order ID against an existing verified Loyalty order when that data is available. Because matching happens when reports are read, a backend order that arrives later can become linked.
An order match does not authenticate the browser visitor, verify that visitor's identity, or award loyalty points. It also does not turn recorded purchases into a causal revenue-impact calculation.
9. Measure ordered conversion separately from milestone reach
Conversion & funnels shows two useful measures. The ordered commerce funnel follows product viewed, add to cart, checkout started, and purchase completed in sequence. The milestone view counts sessions observing each event regardless of order.
Keeping those measures separate prevents a familiar reporting mistake: assuming that everyone who generated a purchase event also followed every earlier step in the expected sequence. A returning buyer, incomplete recording, or unusual navigation path can produce a different event pattern.
Custom funnels support ordered URL patterns and exact event steps. Teams can combine a page step with checkout and purchase events to investigate a specific route. The separate custom-funnel screen retains its own last-thirty-days window and includes test sessions; filters from the newer Reports workspace do not silently apply to it.
Neither funnel view calculates inferred lost revenue or proves that a design change caused conversion lift. Its purpose is to expose the recorded progression and the points worth examining.
10. Separate test sessions and label releases
JourneyLens recognizes configured, signed test-session markers verified by the server. Once a session is marked as test, it remains test for that session. Historical recordings are not retrospectively reclassified, and legacy records remain unknown.
Production analysis defaults exclude marked test and legacy sessions, while the demo defaults to test traffic. The label unmarked means that no valid test marker was observed; it is not proof that the visitor was a real customer. Recordings and reports expose traffic selectors so reviewers can choose the population intentionally.
A release label supplied before the RAS loader can identify new sessions associated with a deployment. Overview can compare two distinct, nonempty release labels. These comparisons support investigation of a change, but differences between recorded groups are descriptive, not automatically an experiment result.
11. Save investigations and make findings shareable internally
Saved Overview investigations preserve the selected dates and filters for a site. Reports can also save its tab, fixed dates, and filter settings, with those views kept separate from Overview investigations. Saving requires the appropriate site-management permission.
Inside replay, reviewers can write an internal note explaining what the visit shows, what needs reproduction, or what should be tested next. Saved notes include an author, timestamp, and an internal reference link. That link does not bypass the permissions required to view recording data.
A useful note might identify the affected control, describe the observed response, and distinguish the observation from the working hypothesis. That gives a developer or client-service colleague something more actionable than a message saying that a customer seemed confused.
12. Use the right alert for the right question
JourneyLens includes two different alert mechanisms. Configurable recipient subscriptions can send session-threshold emails for rage-click, dead-click, or form-abandonment counts, subject to enabled subscriptions and working mail delivery. These are notifications about a captured session meeting a threshold.
Overview also provides aggregate friction warnings comparing the selected period with the preceding equal-length period. Those checks require sufficient recorded sessions and a substantial change: at least thirty sessions in each period, a ten-percentage-point rise, and a two-standard-error threshold. These warnings appear inside the dashboard, not as scheduled email summaries or background monitoring.
The distinction matters operationally. A single-session threshold asks whether one visit deserves review. An aggregate warning asks whether friction appears more common in the selected sample. Neither is a guarantee of a defect or an explanation of its cause.
13. Control collection, masking, and access
Per-site settings let teams enable or pause recording, choose the sample rate, set maximum session length and an inactivity cutoff, and select which interaction types to capture. URL inclusion and exclusion rules define where collection is permitted. Masking controls, custom selector rules, a masking-rule tester, and a privacy launch checklist support configuration review.
Input values are masked in replay snapshots, private data attributes and metadata tags are removed, and stored replay URLs omit credentials, query values, and fragments. Settings include a Do Not Track option. Teams should test the actual pages they operate, particularly where custom components or sensitive content are involved.
Raw recording access is restricted to authorized client users rather than automatically opened to platform-level administrators. These controls support a narrower, intentional collection practice; they should not be represented as a blanket guarantee about every site's privacy obligations or third-party content.
14. Manage retention and collection overhead
JourneyLens reuses the existing RAS loader rather than requiring a second pixel. Sampling, mouse-movement intervals, upload timing, batch limits, snapshot-size limits, storage limits, session duration, and inactivity settings let operators balance coverage with storage and collection overhead.
Retention and extended capture length are controlled by the organization's available entitlements. Settings show the allowed limits rather than assuming every site can retain the longest history. Storage metrics, expired-recording purge controls, and authorized individual deletion provide ways to manage retained recordings.
Queues and checkpoints are bounded. Abrupt browser termination can still prevent delivery, and a stored replay cannot reconstruct events that were never captured. The appropriate question is whether the configured sample is sufficient for the investigation, not whether every visitor can be recorded indefinitely.
15. Check data health before interpreting the charts
Data health shows per-site status, sampling, recent session and event counts, errors, the last event, snapshot coverage, and warnings. It also provides launch checks and custom-event guidance. This gives teams a place to investigate missing evidence before concluding that customers are no longer interacting.
Sampling, page exclusions, disabled capture types, unavailable snapshots, and collection limits all affect coverage. A missing click overlay can be a data-compatibility problem rather than proof that nobody clicked. A checkout milestone can be absent because the integration was not configured, not because checkout never occurred.
For launch or regression testing, validate a permitted page, a known interaction, its stored recording, and the intended report. A successful browser request alone is weaker evidence than confirming that the expected events and page context were persisted.
16. Export reports with their scope intact
Reports provide authenticated CSV exports using the same site, role, and data filters as the selected view. Exports retain the bounded reporting result and protect against spreadsheet formula prefixes. Heatmap and replay drilldowns carry report context so reviewers can inspect evidence from the population they selected.
The reporting limits are part of the interpretation. Reports cap each period at the newest 5,000 pageviews and each event query at 50,000 rows, with partial-data warnings. Tables show up to 100 ranked pages or issues, while CSV includes the whole bounded result. Sessions crossing a date boundary may be only partially represented.
Overview uses a separate 5,000-session cap and disables aggregate alerts if either comparison period exceeds it. Heatmaps have their own limits on pageviews, reference snapshots, and click events. Narrowing the dates or the page group can produce a more useful investigation than treating a capped view as a complete census.
Turn JourneyLens evidence into a focused improvement cycle
Consider a retailer seeing weak mobile progression from product pages to checkout. The team can start with the ordered conversion report, inspect product-page friction, compare mobile click reach, and open recordings from the relevant cohort. A reviewer might discover that a control looks actionable but produces no observed response. That becomes a hypothesis to reproduce, not an immediate claim about lost revenue.
After a fix, a release label provides a way to compare new recorded behavior. A saved investigation preserves the original question, and an internal replay note preserves the evidence. The team can then review whether the signal persists and use an appropriate experiment when a causal claim is needed.
Other RAS modules can complement that work. SiteMetrics provides broader traffic context, Voice of Customer can gather feedback about the experience, and Optimize can support testing a proposed improvement. AdaptiveContent, ProductLift, Abandonment Recovery, and Loyalty Engine address different experience and engagement needs. Their use requires their own configuration; JourneyLens does not automatically activate a campaign or correct the site.
The value is a clearer path from observation to action
JourneyLens brings together capture controls, searchable recordings, timestamp-based replay, friction signals, layout-aware heatmaps, commerce milestones, conversion reports, release context, saved investigations, alerts, notes, exports, and data-health tools. Each feature becomes more useful when it answers a defined operational question.
The goal is not to watch more sessions or collect more screenshots. It is to understand which problems deserve attention, give the right people usable evidence, and verify what happens after a change. Used that way, JourneyLens helps businesses replace vague explanations of customer behavior with a more disciplined investigation process.