
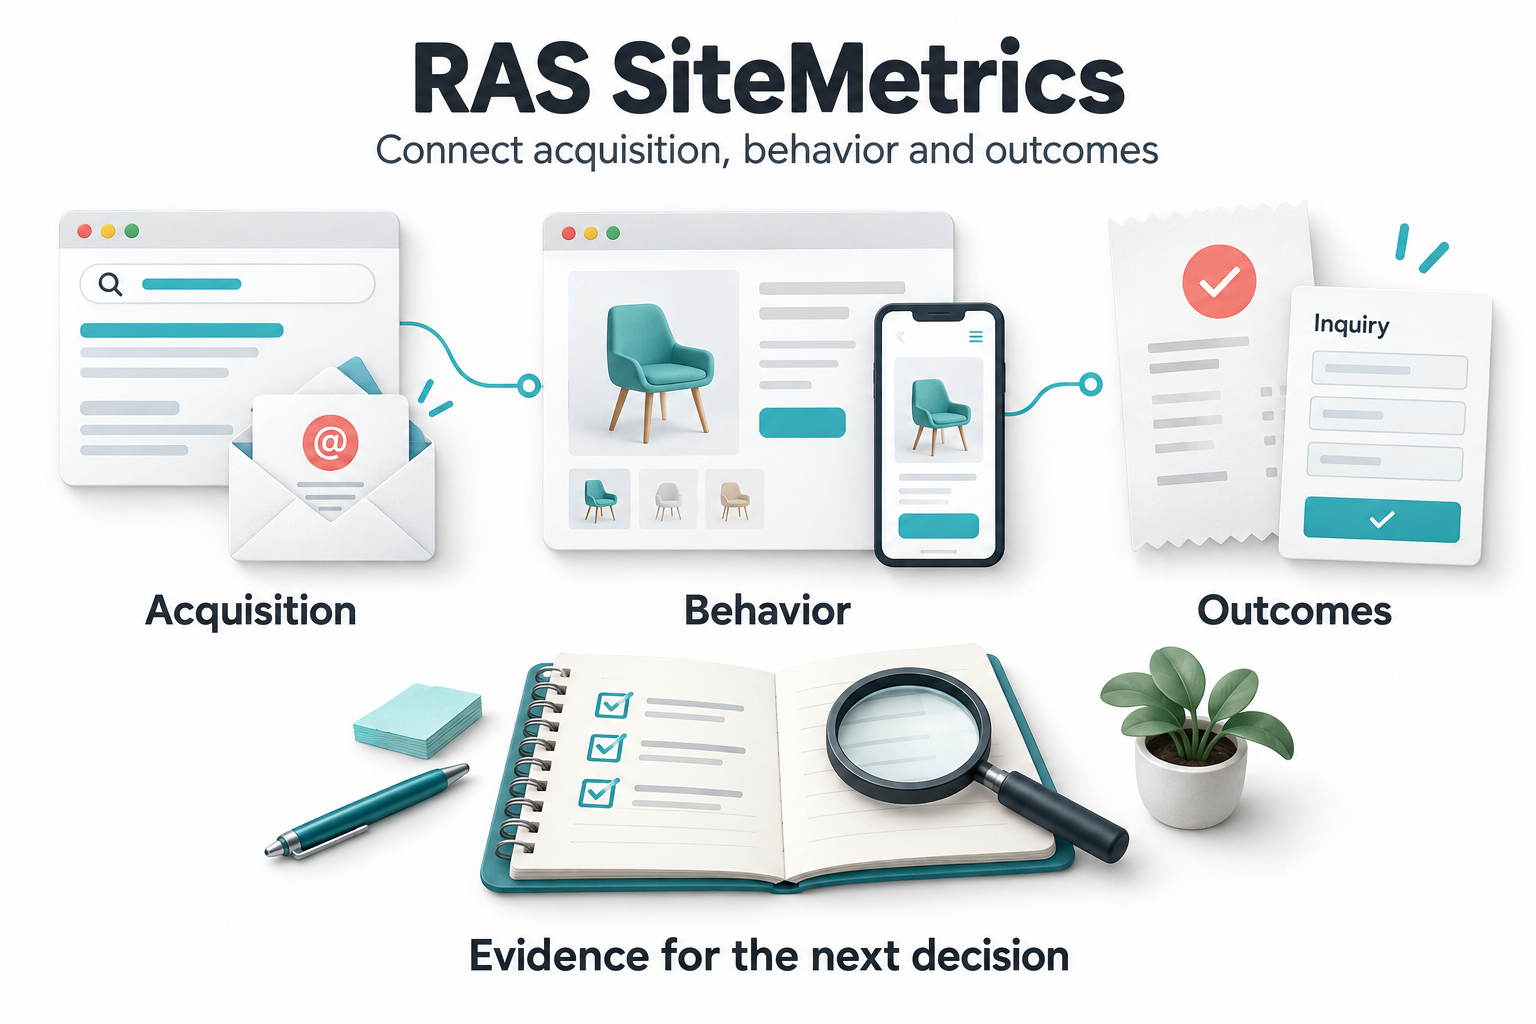
Website analytics should help a team decide what to do next
More visits can look like progress while a business receives fewer useful inquiries. A campaign can generate orders without being the first interaction that introduced the customer. A popular product page can attract attention while leaving shoppers unsure about their next step.
RAS SiteMetrics connects acquisition, on-site behavior, and measured outcomes so teams can investigate those situations. Its role is not simply to produce a larger traffic report. It is to give marketing, ecommerce, product, and service teams a shared starting point for deciding what deserves attention.
This guide covers the current workspace, collection definitions, acquisition and attribution, commerce, goals and funnels, segments, reporting, diagnostics, and integration features. Availability depends on the deployed SiteMetrics upgrades and connected website setup. The visuals are explanatory illustrations, not product screenshots or real performance results.
1. Move from overview to a specific business question
The workspace brings together Overview, Acquisition, Pages & journeys, Commerce, Goals & funnels, Audiences, Reports, Settings, and Help. Site-scoped access keeps the analysis tied to the intended website, while management permissions protect definitions, cost imports, and report-generation actions.
Overview presents sessions, measured browsers, engagement rate, purchasing-session rate, distinct orders, page views, daily visits, and revenue separated by currency. These measures answer different questions. A purchasing-session rate is not the same as the number of orders, and a measured browser is not necessarily a unique person.
A practical review can start with traffic, check acquisition quality, inspect the relevant page journey, and then examine a business outcome. That progression is more useful than treating every chart as an independent score.
2. Use explicit visit and engagement definitions
A SiteMetrics visit expires after thirty minutes without a received event. Foreground heartbeat events keep an active visit updated approximately once a minute. Browser identity is site-specific and first party, with an in-memory fallback when persistent storage is unavailable.
Engagement requires ten foreground seconds, two distinct page views, or a purchase. A page left open in a hidden tab is not equivalent to continued foreground activity. These rules make engagement interpretable, but they do not establish that a visitor read or understood the content.
Page identities help prevent repeated receipt of the same page view from inflating counts. Meaningful path changes in a single-page application can produce a new page view, while same-path query or history updates do not automatically create one. A site whose content changes only through query parameters needs a deliberate page-identity design.
Cleared storage, another browser, or another device can create a different identity. Without storage, identity cannot reliably survive a full reload. Reports therefore use the language of measured browsers rather than claiming verified customer recognition.
3. Collect behavioral signals without confusing them with success
The collector supports page views, engagement, foreground activity, scroll milestones, outbound clicks, and form attempts. Scroll milestones use the scrollable distance at twenty-five, fifty, seventy-five, and one hundred percent; they do not certify that the corresponding content was read.
Shared commerce events add product views, cart additions, checkout starts, purchases, search, and refunds when the integration supplies them. Custom events support additional business actions through EDSA.SiteMetrics.track(...).
Automatic form tracking records an attempt, not an accepted lead. A quote request rejected by validation should not be treated as a completed inquiry. The application should emit a confirmed success event, such as lead_completed, only after acceptance. The conversion helper supports that explicit success signal.
Event names alone do not install the underlying measurement. A newsletter signup, booking request, or qualified inquiry needs a correctly placed integration call before a goal can report it meaningfully.
4. Compare acquisition quality, not only traffic volume
Acquisition reporting groups sessions by source, medium, campaign, and tactic, alongside engagement counts. Channel groupings distinguish direct, organic and paid search, organic and paid social, email, SMS, affiliate, display, referral, supported AI-referral sources, and other or unclassified traffic.
Those labels depend on observed referrers and declared media. Unknown media remain unclassified rather than being silently assigned to the nearest attractive category. Correct campaign tagging is therefore part of measurement quality.
For example, a paid campaign producing many short visits may require a different investigation from an email campaign producing fewer but more engaged visits. Neither traffic volume nor engagement alone establishes commercial value; the next step is to inspect goals and commerce outcomes.
Session acquisition remains fixed, while a later qualified tagged or referral arrival can become a separate attribution touch. The source of a visit and the sequence of arrivals preceding an order are related but distinct views.
5. Build campaign links and manage referral exclusions
The campaign link builder creates tagged destinations using source, medium, campaign ID, tactic ID, and creative parameters. Stable campaign and ad-group or ad-set IDs should match the identifiers used in cost exports.
Campaign definitions help organize IDs, but they do not automatically populate every tracking link. The operator still needs to enter the corresponding identifiers consistently. Renaming a campaign informally in one report does not reconcile mismatched IDs across systems.
Referral exclusions accept exact hostnames, including payment providers that should not be mistaken for an acquisition source when a customer returns to the site. Internal navigation should not carry acquisition tags, because those tags can create misleading touches inside an otherwise continuous journey.
6. Explore five attribution models
SiteMetrics assigns credit across eligible observed arrivals within a configurable one-to-ninety-day lookback. The five models offer different descriptions of the same measured path:
- First non-direct: Credit the first eligible non-direct arrival.
- Last non-direct: Credit the last eligible non-direct arrival before the order.
- Linear: Share credit equally across eligible touches.
- Time decay: Give more weight to recent touches using a seven-day half-life.
- Position based: Give forty percent to the first touch, forty percent to the last, and share twenty percent across intermediate touches; two touches split equally.
Direct receives credit when no eligible non-direct touch exists. The report can compare all five models and show observed conversion paths. Credit is allocated within a measured browser and traffic class, not across inferred identities on different devices.
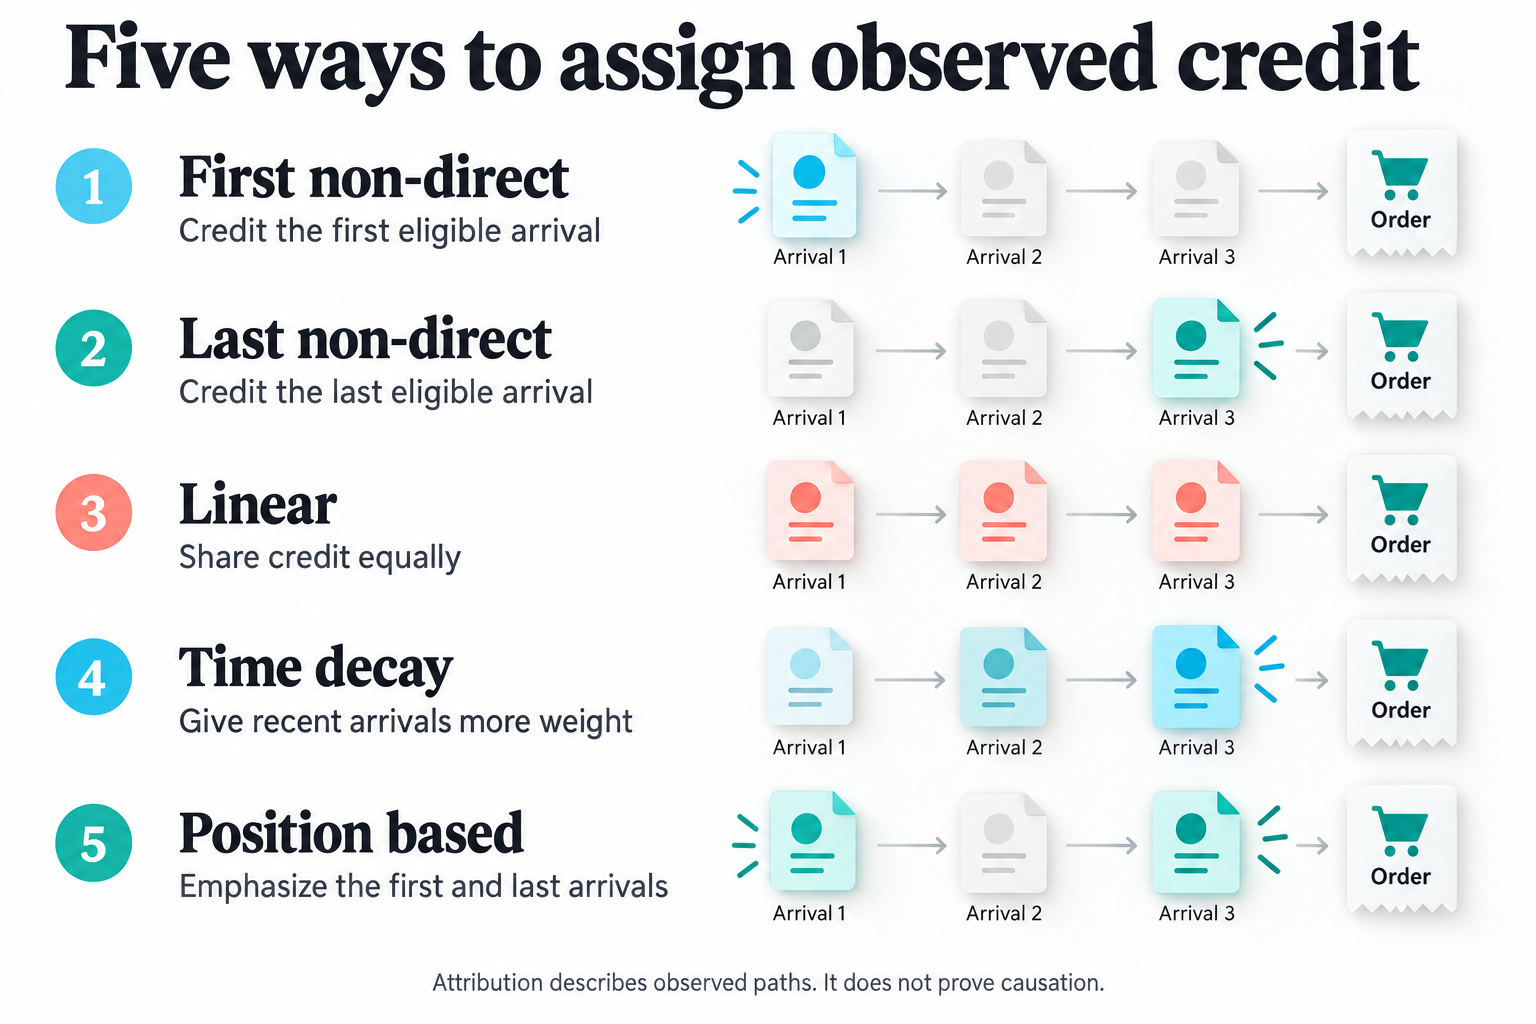
These models do not infer advertising impressions, recover missing cross-device interactions, or produce a causal confidence score. A source receiving more credit under one model is a reason to examine the journey, not proof that moving budget to it will increase sales.
7. Bring campaign cost exports into the same review
Cost imports accept a normalized CSV format and adapters for Google Ads and Meta exports. They use daily campaign, tactic, currency, and amount values. The adapters are file-based imports, not live OAuth connections or automatic advertising API synchronization.
The importer validates the file before transactional writes, with limits of one megabyte and two thousand rows. Reimporting the same date, campaign, tactic, and currency replaces that daily total rather than adding it again.
Dates and reporting timezones need to be normalized before import. Amounts should use plain decimal formatting without locale thousands separators. Missing spend is not zero spend, and importing an incomplete export can distort the comparison even when the file itself is valid.
This workflow is useful for teams that want a controlled, reviewable connection between campaign tags and exported spend without introducing another live account integration.
8. Read spend efficiency with the right denominator
When the selection is complete, unsegmented, and based on unmarked traffic, SiteMetrics can show attributed net revenue, return on ad spend, and cost per attributed order for matching campaign, tactic, and currency identifiers.
Segmented revenue is not compared with whole-campaign spend as though they covered the same audience. Demo revenue is not used for production ROAS, and currencies are not combined into an artificial single total.
These are period-based comparisons of observed conversion revenue and imported spend. They are not campaign-lifetime profitability, lifetime value, or proof of incremental return. Product costs, operating costs, missing events, attribution assumptions, and other business factors still matter.
9. Inspect pages, page groups, and observed journeys
Pages & journeys shows page activity, named page groups, observed transitions, and last observed pages. Page groups use the first matching configured path prefix, allowing related URLs to be reviewed under a recognizable name.
A retailer might group product-detail routes, while a service business might group service-area pages or quote pages. The grouping should reflect a business question, not merely make the table shorter. Overlapping prefixes need review because the first matching definition determines the group.
Transitions show movement between recorded page views. The last observed page is not proof of a final exit: collection may stop because of navigation, consent, a blocker, network conditions, or the end of observable activity.
Available site-scoped JourneyLens recording links support investigation of individual behavior. Access remains protected, and a missing recording does not invalidate the analytics session.
10. Examine returning-browser cohorts without calling them lifetime retention
Returning-browser cohorts group browsers by their first observed session within the selected reporting window and count whether they returned during that window.
This can help identify repeated browsing during a campaign or a consideration period. It does not establish the customer's original acquisition date, lifetime retention, or an account-based relationship across devices.
Recent cohorts have less time to return than earlier ones. Comparing them without acknowledging that difference can turn an incomplete observation period into an apparent retention problem.
11. Add performance observations to the investigation
SiteMetrics collects page-lifetime Largest Contentful Paint observations, diagnostic cumulative layout shifts, and maximum observed interaction duration where browser support permits. Reports show sample counts and seventy-fifth-percentile values.
The layout-shift and interaction measurements are diagnostics, not certified implementations of Core Web Vitals CLS and INP. A team should not relabel them as those official metrics or compare them indiscriminately with a different measurement system.
Performance evidence is most useful alongside the relevant page, device, and business behavior. Slow rendering near a form may deserve investigation, but a performance sample alone does not prove why a particular visitor failed to convert.
12. Define goals around meaningful completed actions
Goals count distinct matching sessions, with completion rates calculated against the selected sessions. The editor offers event presets and custom names, with filters such as acquisition fields, device, and page-path prefix.
A service business can define a goal for a confirmed inquiry, while a retailer can define a purchase or cart-related goal. Repeated matching events in the same session do not turn that session into several goal completions.
Definitions can be edited and archived or restored. Each edit creates an immutable revision. Live analysis uses the current definitions, while saved report snapshots retain the definitions they used. This prevents an older saved report from silently acquiring a new meaning after a goal is changed.
13. Use ordered funnels to distinguish sequence from event volume
Funnels support two to eight event steps in order within one visit. A commerce funnel might follow product view, add to cart, checkout start, and purchase. A lead-generation flow can use appropriately instrumented events for its own stages.
Raw counts of checkout starts and purchases are not the same as funnel completion. The funnel checks whether a visit progressed through the configured sequence and displays step counts and progression percentages.
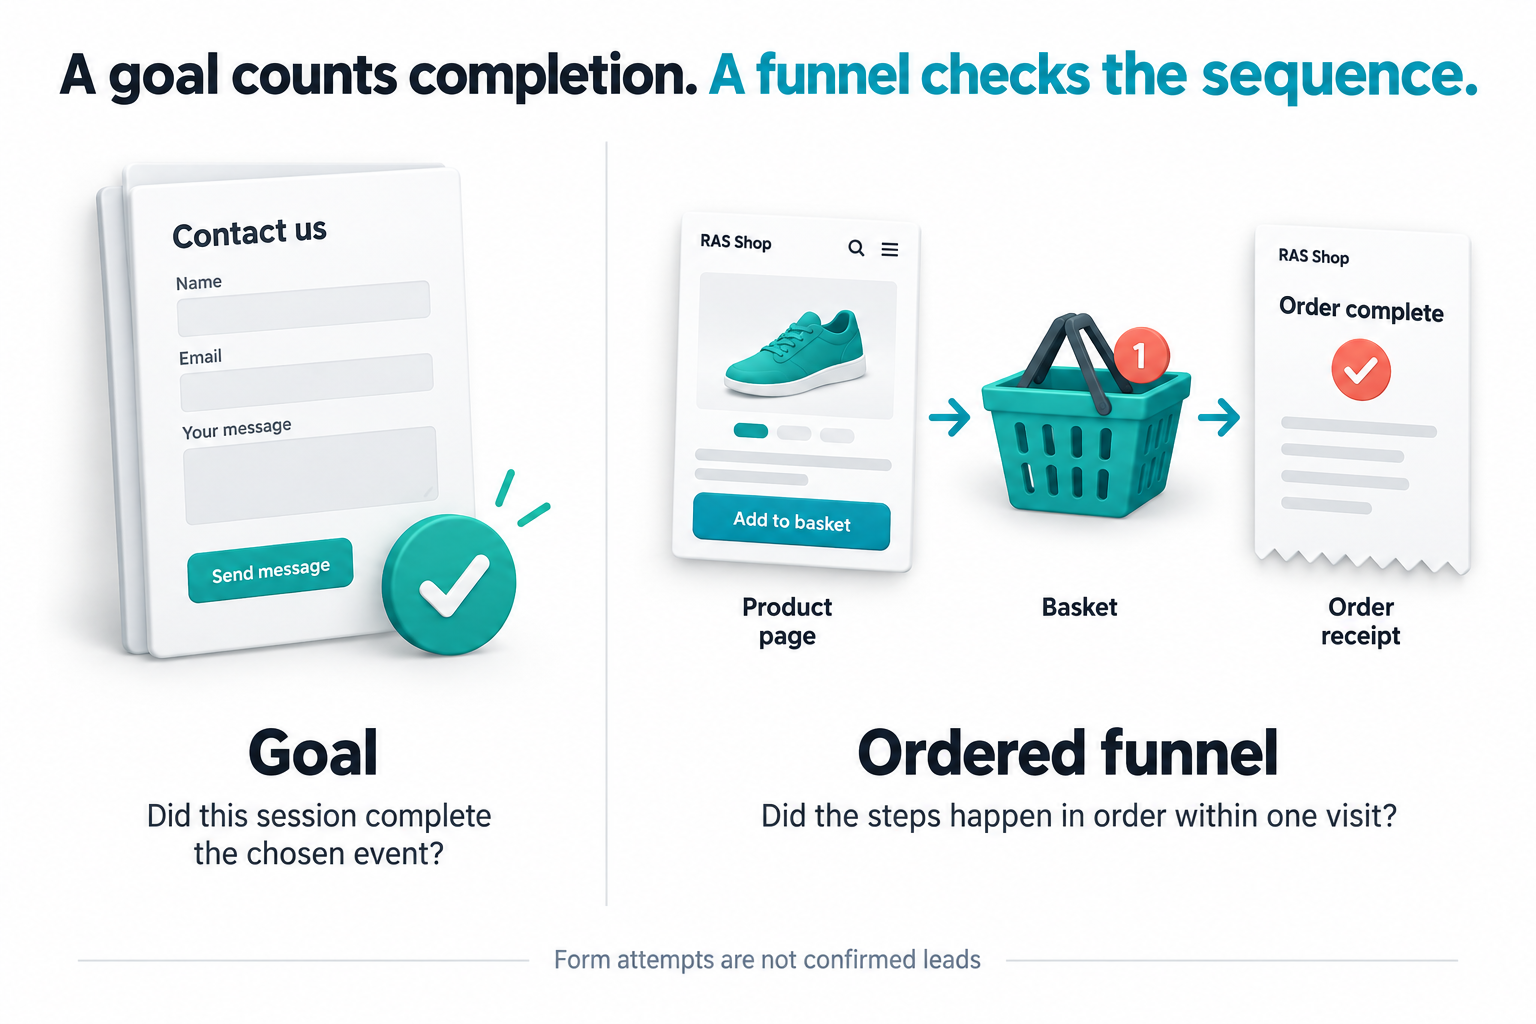
The resulting drop-off is a starting point for investigation, not a diagnosis by itself. Missing instrumentation can look like abandonment. Validate the event sequence before treating the gap as a customer-experience failure.
14. Save audiences as reusable analysis segments
The Audiences area maintains saved segments based on session acquisition, device, and landing-path rules. Teams can create, edit, archive, and restore definitions, then apply a saved segment to workspace analysis.
These are reporting segments, not automatically activated advertising audiences or cross-channel customer profiles. Event-level product and category behavior is not implemented as a session-audience filter in the current interface.
For an agency, a saved mobile paid-search segment can make recurring analysis more consistent. It still needs sufficient data and a clear question; narrowing the selection until a favorable number appears is not a reliable improvement process.
15. Review purchases, products, and refunds together
Commerce reporting includes distinct orders, purchasing sessions, gross revenue, reported refunds, and net amounts separated by currency. Purchased-product tables show product and variant IDs, quantities, and supplied gross line values.
Purchases require a stable order ID, total, and three-letter currency code. Order identity prevents reloads and retries from adding the same revenue repeatedly. Product line totals must come from the integration rather than being inferred from the basket.
Refund events supply the cumulative refunded amount for the original measured order, using the original browser identity and matching currency. Repeated cumulative updates do not subtract the same refund twice. This is a reported refund workflow, not an automatic connection to the payment processor.
Product-level amounts remain gross because order refunds are not allocated back to individual product lines. Net order revenue is not profit, and browser-reported orders are not backend-verified financial records. Authoritative reconciliation requires a separate authenticated integration.
16. Keep report dates and traffic classes explicit
Workspace reports use session-start cohorts: the session must start within the selected dates, and its included events and orders must also fall inside that date range. This differs from a report that selects all events regardless of when the visit began.
Date boundaries use database dates, so application and database clocks should be consistent. Previous-period comparison currently covers sessions and engagement for unsegmented selections rather than providing a universal comparison for every metric and audience.
Demo/test traffic is separated from unmarked traffic. Demo-host classification is server-side; non-demo synthetic traffic needs the configured signed test proof. Unmarked does not mean verified human, and the current classification is not a comprehensive bot or internal-traffic detection system.
Historical events, pages, and sources remain accessible through their older reporting paths. They are not merged into the new workspace because the collection and session definitions differ. A chart discontinuity across the upgrade should not automatically be interpreted as a business trend.
17. Export selections and preserve report snapshots
CSV export includes summary, currency, acquisition, attribution, goal, and funnel sections for the selected analysis. It supports review outside the portal without adding a public report endpoint.
Saved report definitions preserve the intended filters, traffic class, attribution model, and lookback. Generate snapshot now creates a report for the previous thirty complete database dates. Saved snapshots freeze the definitions and model used, so a later configuration edit does not rewrite that record.
Scheduled definitions can generate daily snapshots through the separate CLI report worker when an operator has configured the hosting schedule. The worker prevents overlapping runs and duplicate daily snapshots, with bounded work per invocation.
Selecting a daily schedule in the portal does not install a server cron job. Snapshots appear under Reports; no automatic email delivery is included. Teams should verify the worker and its error reporting before relying on unattended generation.
18. Use alerts as prompts for investigation
SiteMetrics includes disclosed threshold warnings. Examples include low engagement after a minimum number of sessions, checkout events arriving without purchases, and a configured decline in sessions compared with a completed previous period.
Period-drop alerts require a minimum baseline and completed periods. They are not learned anomaly models or statistical significance claims. A checkout warning deliberately prompts an integration check before concluding that customers abandoned their purchases.
The reports also declare their data bounds: twenty thousand history sessions, twenty thousand touches, fifty thousand events, and ten thousand orders. Exceeding a cap marks the report incomplete, including attribution, and means the dates should be narrowed before using totals for decisions.
The current release does not claim unlimited warehouse-scale aggregation. There is no new v2 daily-rollup worker or automatic age-based deletion job, so workload and retention planning remain part of production operation.
19. Verify collection and respect data boundaries
The current collector receives synchronous persisted-event receipts. Site-scoped event keys deduplicate retries, and a different payload using the same identity is rejected. The browser uses a bounded in-memory retry queue rather than promising durable offline delivery across navigation or shutdown.
Collection observes the shared runtime's suppression state before visitor-storage access and sending. Payloads omit full query strings, referrer queries, form values, customer fields, and loyalty proofs. Only allowed contextual fields and structured commerce data are sent.
Operators must still avoid personal information in event names, URL paths, campaign tags, and product or order identifiers. These boundaries reduce unnecessary collection; they do not make every integration automatically compliant or remove the need for a retention policy.
Received events use database receipt time, not reconstructed offline event time. When reports look empty, check the site, date and traffic selection, permissions, entitlement and event capacity, script version, suppression settings, integration, and stored receipt rather than assuming that a successful browser request proves collection.
20. Turn the findings into focused work across RAS
Consider a service business whose paid-search campaign produces visits but few accepted inquiries. SiteMetrics can compare the acquisition segment, inspect relevant pages, and distinguish form attempts from confirmed leads. JourneyLens can help investigate the interaction, while Voice of Customer can surface the unanswered question.
For an ecommerce store, the same workflow can connect acquisition with product views, cart progression, purchases, and reported refunds. ProductLift or AdaptiveContent may address a specific discovery or explanation problem, while Abandonment Recovery may be relevant to a documented exit pattern.
Optimize provides the controlled-experiment workflow when the team needs to test whether a proposed change improves an independently defined outcome. SiteMetrics offers investigation links and evidence; it does not automatically assign marketing holdouts, modify advertising budgets, or prove the intervention caused a sale.
Make analytics a shared decision process
The value of SiteMetrics is the connection between definitions, observed journeys, commercial outcomes, and repeatable reporting. Sessions, channels, attribution models, goals, funnels, segments, commerce, cost imports, diagnostics, and snapshots each contribute a different piece of that picture.
A useful review begins with one question: which visitors are failing to reach which meaningful next step? Confirm that the measurement is complete enough to answer it, investigate the relevant behavior, and select a focused improvement to test.
That approach gives teams more than a traffic count. It gives them a clearer basis for deciding what to investigate, what to change, and what the available evidence can honestly support.